Thursday, August 28, 2014

Deep tropical moisture brings wet weather pattern this weekend

Surface Analysis Chart valid Thursday at 1 PM from the Weather Prediction Center
Above is today's surface analysis from the Weather Prediction Center. It's not a surprise that there's plenty of warm temperatures across the southern U.S., but the past couple of days we have been enjoying a bit lower humidity at the surface courtesy of easterly wind. This is beginning to change as our wind shifts toward the south and moisture rich air streams in from the Gulf of Mexico. The approaching low pressure system from the west will strengthen that southerly flow. By tomorrow afternoon, humidity will return to higher levels (along with a slight chance of t'storms).
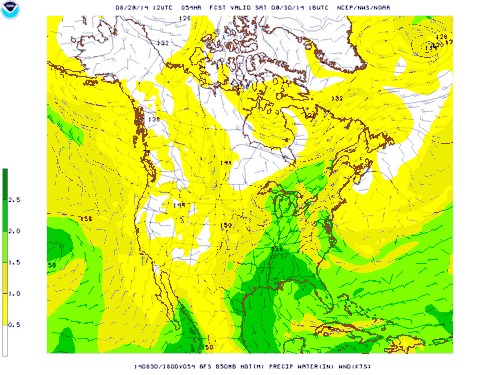
Precipitable water values and low level wind early Saturday afternoon
The lowest levels of the atmosphere will not be the only portion seeing an increase in moisture. The map above shows precipitable water values, or basically how much precipitation would occur if all the mass of water vapor in the atmosphere was brought to the surface as rain. This indicates very deep moisture through western Tennessee with precipitable water values of over 2.0 inches. The wind barbs show southerly winds in the lower levels of the atmosphere bringing a plume of moisture northward from the Gulf of Mexico.

Quantitative Precipitation Forecast through Sunday evening from the Weather Prediction Center 
Above is the NWS Weather Prediction Center's quantitative precipitation forecast for this weekend. They're calling for nearly an inch and a half of rain, with higher amounts southwest of the metro. The Weather Prediction Center expects more of the rainfall to be focused on Sunday, while we're currently forecasting a good chance of showers and thunderstorms on both Saturday and Sunday. Unfortunately, that means decent chances of rain for both the season opener for the University of Memphis football team on Saturday evening and the opening weekend of the Delta Fair at the Agricenter.

William Churchill, MWN Social Media Intern

----
Follow MWN on Facebook, Twitter, and Google+
Visit MemphisWeather.net on the web or m.memphisweather.net on your mobile phone.
Download our iPhone or Android apps, featuring StormWatch+ severe weather alerts!

Tuesday, August 26, 2014

Summer continues for now, but tropical moisture will affect holiday weekend plans

A massive upper-level high pressure ridge has receded a bit, but hot and dry weather continues until tropical moisture arrives, just in time for the holiday weekend!

Abnormally dry weather over the past month has resulted in very dry vegetation and soil. A strong upper-level ridge that was in place over the weekend combined with the dry conditions to create record heat, with the mercury reaching the century mark for the first time in over two years on Sunday and tying the record high for the date. (The last time Memphis hit 100 - actually 101 - was July 30, 2012). Another record was tied Monday morning as the low only dropped to 79. Thankfully the ridge receded a bit and temperatures have responded, only reaching the mid 90s Monday and lower 90s today. With wind out of the east to southeast during the middle of this week, dewpoints will also fall just a bit. Though highs will remain in the mid 90s through the end of the week, heat indices won't top 100 thanks to slightly lower afternoon humidity.

A large ridge of high pressure at the mid levels of the atmosphere (18,000' feet) dominates the eastern 2/3 of the nation Monday night. This is keeping hot and dry weather in place across the Mid-South. Hurricanes Cristobal and Marie are also noted. Neither pose a threat to land areas. Click for larger image.

However, to our south, tropical moisture is sitting over the northwestern Gulf of Mexico, off the Louisiana and Texas coastline. The National Hurricane Center is monitoring this area and a short-lived tropical depression is possible. However, even if it doesn't, as high pressure moves east, southerly flow will push that tropical moisture north, putting the lower Mississippi Valley and Mid-South in its path.

Precipitable water (PW) values as of mid-day Wednesday. PW shows areas with high moisture content in the atmosphere. In this case, tropical moisture is sitting over the northwestern Gulf off the coast of TX. This moisture will be pulled north this weekend on southerly flow. There is also obviously a great deal of moisture in Hurricane Cristobal.

We'll notice this pattern shift by Friday and especially into the holiday weekend as dewpoints (humidity) rise, cloud cover increases, and showers and thunderstorms enter the forecast. In fact, this weekend may bring the best chances of widespread rain to the area in over a month. For now, severe weather is not a big concern, though heavy rainfall will be possible in areas that receive multiple storms.

By Friday evening, the ridge over the Pacfic strengthens, the ridge in the middle of the country moves east to the southeastern U.S., and well-established southerly flow exists over the Mid-South. This setup pulls Gulf moisture north into the region, resulting in decent rain chances. Click for larger image.
Forecast rainfall amounts from Friday evening through Sunday by the National Weather Service. A welcome 0.5"-1" of rain is possible and more could be expected in areas that receive multiple storms. Click for larger image.
So, for the rest of the week, enjoy hot, but not overly humid, days and prepare for the possibility of occasional rain on outdoor plans this Labor Day weekend, including the University of Memphis football team's home opener against Austin Peay on Saturday evening and the opening weekend of the Delta Fair. Find the complete MWN Forecast on our mobile apps (links below) or click here for our mobile website forecast.

Erik Proseus
MWN Meteorologist

----
Follow MWN on Facebook, Twitter, and Google+
Visit MemphisWeather.net on the web or m.memphisweather.net on your mobile phone.
Download our iPhone or Android apps, featuring StormWatch+ severe weather alerts!

Monday, August 25, 2014

What do they say about broken clocks?

From the Farmer's Almanac, via the NY Post, I find this screen capture incredibly ironic:


The article above, dated April 14th and quoting the Farmer's Almanac (which I pulled up this morning on the NYC Post website), indicates an "oppressively hot and humid summer" for the New York area. In the margin are suggested articles relating to weather (that are obviously more recent). There we find  a headline stating "Summer 2014 is the coldest in a decade" (again, relating to New York). Wait a minute...

Say it ain't so!? The Farmer's Almanac -which boasts an 80% accuracy rating - was wrong (again)??

I pulled this year's stats for Central Park for June 1-August 25 (today). The average temperature has been 74.2, which is almost exactly the median over the nearly 140-year record at Central Park. In other words, it was an "average" summer by that metric. However, as quoted in the "coldest in a decade" article above, I also discovered that the highest temperature so far this summer in Central Park has been 91 degrees, which is the 3rd coolest high temperature ever recorded during a Central Park summer since records began (1876).

Graph showing the highest temperature recorded between June 1-August 31 each year at Central Park. In 2014, the highest temp of 91 is the 3rd coolest high temp ever recorded.
So why do I bring this up?

Because people are already asking what this winter will bring. Winter outlooks are starting to pop up, including the latest from the Farmer's Almanac, which predicts "colder-than-normal and wetter-than-usual weather for three-quarters of the country east of the Rocky Mountains,” according to the AP.  (By the way, the Farmer's Almanac says "chilly and wet" for the southeast U.S., while the OLD Farmer's Almanac predicts "much colder than normal, with below-normal precipitation." Which Almanac should I trust??  Are OLD farmers better weather-guessers than your average farmer?

There are hints, signs, and long-range models that will point you one direction or another. I can show you "evidence" of everything from cold to warm and wet and snowy to dry for our neck of the woods. I can tell you what it "should" do based on the El Nino that is "imminent," and then I will tell you El Nino isn't behaving like the PhD's that are way smarter than me thought it would. The truth is, I honestly have no idea what winter will be like.

If you like reading the Farmer's Almanac (either one of them), by all means go right ahead. But don't bring me their forecast and ask me to refute or defend it. It won't happen. "But it was right back when _______" you'll say! And I'll remind you of the old adage: even a broken clock is right twice a day.

Erik Proseus
MWN Meteorologist

----
Follow MWN on Facebook, Twitter, and Google+
Visit MemphisWeather.net on the web or m.memphisweather.net on your mobile phone.
Download our iPhone or Android apps, featuring StormWatch+ severe weather alerts!

Sunday, August 17, 2014

Storm Prediction Center revises severe weather outlook categories

Beginning up to eight days ahead of potential severe weather, the Storm Prediction Center (SPC), a part of NOAA/NWS and the worldwide leaders in severe weather prediction, begins issuing outlooks (sometimes called risk areas) for the probability of severe storms.  For many years, these outlooks have included a "general thunderstorm" area, as well as Slight, Moderate, and High Risk areas.

In recent years, especially with the widespread use of social media and availability of information around the clock and at our fingertips, many more people have become familiar with these outlooks and the terms used.  There has also been a call to update the outlooks to provide better delineation of the risk that the public faces from severe storms.  In particular, "Slight Risk days" seem to cover a wide gamut of severe weather possibilities, from a small threat for a damaging wind gust or large hail to something just short of a tornado outbreak.

Responding to the call to better define the risk, take into consideration the research and advice of social scientists who specialize in communicating risk or threat to the general public, and to provide better consistency with other NWS products, SPC will use a new classification system for their severe weather outlooks starting October 22, 2014.  The new system can be found in the tables below (pay particular attention to the first table).  The probability of tornadoes, 1"+ hail, and/or 58+ mph wind in a particular area defines the risk outlook category issued by SPC.  NOTE: There will be NO changes to the watches or warnings issued as a result of this modification.  


Top: New classification system to be used by the NWS for severe weather outlooks beginning October 22, compared to the current scheme. Bottom: probability of each type of severe weather that corresponds to each risk category. For instance, an area on day 1 that has a 15% probability of a tornado will be in an Enhanced risk. "Sig" (significant severe) indicates that there is a 10% or higher probability of  EF-2 or stronger tornadoes, 74+ mph wind, or 2"+ hail.
The biggest change we will see will be the addition of two new risk areas - "Marginal" and "Enhanced."  The Marginal Risk indicates that the chance of severe weather is very low but not non-existent (or marginal). The Marginal Risk would replace the current "See Text" areas in the outlooks. According to table above, areas under a marginal risk of severe weather have a low chance of severe storms - less than the slight risk of previous years.  Enhanced Risk indicates a more significant chance of severe storms and it will be used for "high-end" slight risk areas.  In other words, the current slight risk category will be split between "slight" and "enhanced."  Enhanced risk indicates a higher chance of severe weather than slight risk, but not quite up to a moderate risk.  There will be no changes to the moderate or high risk areas.

In addition, each Severe Weather Outlook text bulletin that accompanies the maps will contain a "public" section that describes the weather risks for that day in non-meteorological jargon, so that the general public can understand the threat. An example of a day which had a high risk of severe weather (May 24, 2011) is shown below, followed by what the outlook areas would look like under the new classification system (click each for a larger image).

Example showing the classification system for severe weather outlooks as used on May 24, 2011

How the convective outlook would look for May 24, 2011 using the new classification system
We understand that this change seems to make things more complicated. While the changes will be fairly well understood by meteorologists and NWS partners, education will be necessary for those who do not look at these categories on a daily basis. We at MWN are considering using a supplemental scale, in addition to the new categories, to help better define the risk - perhaps a numerical scale (1 to 5) similar to the Saffir-Simpson Hurricane Wind Scale and the Enhanced Fujita Scale for tornadoes.

We'd love your feedback! Let us know how we can make the transition easier for you, as ultimately the decision to prepare and take action in the face of severe weather lies in our ability to communicate the threat and your willingness to react.

----
Follow MWN on Facebook, Twitter, and Google+
Visit MemphisWeather.net on the web or m.memphisweather.net on your mobile phone.
Download our iPhone or Android apps, featuring StormWatch+ severe weather alerts!

Saturday, August 16, 2014

Shifting upper level pattern means changes in Mid-South weather

A very cool July has spilled over into August with the first half of the month averaging 1.9 degrees below normal. This past week especially was very pleasant with below normal temps and humidity, resulting in weather that felt more like mid-September. However, the upper level trough over the eastern U.S. that was present this week and has dominated much of the summer has departed, allowing for warmer and more humid air to begin making its way back into the Mid-South.

A large trough of low pressure at the mid levels of the atmosphere (18,000') was present earlier this week, bringing cooler weather to the eastern U.S. and Mid-South.
The upper level pattern this weekend into early next week will be more "zonal," meaning air will move west to east with a lack of troughs and ridges (or hills and valleys) in the pattern. A zonal flow typically means near average conditions with weather systems moving west to east that tend not to be very strong.

A zonal pattern is evident at the jetstream level (34,000') by Sunday evening as wind flows across the country pretty much from west to east with no major hills or valleys in the pressure field across the CONUS.

In this case, we need to remember that we are, climatologically-speaking, just past the hottest part of the year. So a "normal" pattern will mean warmer and more humid conditions. In addition, we'll see increased chances of rain and thunderstorms. Since a zonal flow typically doesn't result in strong weather systems, severe weather is not expected, though summertime storms can result in strong wind gusts and brief downpours due to strong heating of the lower atmosphere and higher humidity levels. This hot, humid pattern with chances of thunderstorms is expected from Sunday through the first half of the week.

By mid-week, a large ridge of high pressure looks to build in the upper levels over the central U.S. and slowly shift east late this week. High pressure aloft generally forces weather systems north (or over the ridge) and result in above normal temperatures under the ridge.

The pattern at jetstream level (34,000') by Thursday shows a ridge of high pressure building over the central U.S (note the "hill" in the solid black lines over the Plains. Upper level ridges typically result in drier and hotter surface weather.

The result for us? A drying pattern with hotter temps. In fact, some model data is pointing to high temperatures approaching 100 by next weekend, though we've seen the same data forecast temperatures that were too warm many times this summer. Mid 90s could be a fairly safe bet though for late week into next weekend. In fact, the Climate Prediction Center's 8-14 day outlook covering the last week of August shows that this pattern may stick around, resulting in above normal temperatures for the rest of the month. The atmosphere tends to balance itself out over time, so this may be payback for a mild summer! We've only had a single 95 degree day this summer, so we're still due for some heat.

The 8-14 day outlook from CPC for August 23-29 indicates a 50% chance of above normal temperatures.

For the complete MWN Forecast for the upcoming week, click here or visit our mobile apps, linked below.

--Erik Proseus, MWN Meteorologist

----
Follow MWN on Facebook, Twitter, and Google+
Visit MemphisWeather.net on the web or m.memphisweather.net on your mobile phone.
Download our iPhone or Android apps, featuring StormWatch+ severe weather alerts!

Thursday, August 7, 2014

July 2014 Weather Recap and MWN Forecast Accuracy

July Recap

As mentioned last month, each month in 2014 has experienced below normal average temperatures. July 2014 not only was below normal, but was nearly record-breaking in that regard! The average temperature for the month at Memphis International Airport was 4.7 degrees below normal, ending as the sixth coolest Memphis July in 140 years of record-keeping. In fact, the average temperature for the month was cooler than June's average temp. Two record low maximum temperatures were set, including a high of 69 on the 18th that went down as the first high temperature below 70 ever recorded in the month of July! Through July, the average temperature for the year so far ranks 11th coolest on record.

Precipitation-wise, after an extremely wet June, the month ended up well below normal with just 56% of normal July rainfall. Flooding in June was long gone, replaced by browning and wilting vegetation by the end of July. For the year, precipitation is still 129% of normal, or near 9.5" above normal. The only severe weather in July was wind damage in eastern Shelby County on the 14th from scattered strong storms and isolated flooding on the 9th in Fayette County and on the 23rd in southern Shelby County.

Memphis International Airport, Memphis, TN

Temperature
Average temperature: 78.0 degrees (4.7 degrees below average)
Average high temperature: 86.5 degrees
Average low temperature: 69.5 degrees
Warmest temperature: 95 degrees (14th)
Coolest temperature: 62 degrees (16th)
Records set or tied: Record low maximum of 69 on the 18th and record low maximum of 79 on the 19th.
Comments: Eleven days had maximum temperatures at or above 90. Three days had maximum temperatures that were below 80 (two of which set records). The average temperature of 78.0 degrees is the sixth coolest July on record. For the year, the average temperature at Memphis is 59.6 degrees, which is 2.9 degrees below average.

Precipitation
Monthly total: 2.56 " (2.03" below average)
Days with measurable precipitation: 10
Wettest 24-hour period: 0.87" (July 8-9)
Records set or tied: None
Comments: Zero days had more than 1" of rain and three days recorded more than 0.50". As of the end of July, the yearly precipitation has been 41.92", which is 9.42" above (or 129% of) average.

Miscellaneous
Peak wind: West/47 mph (14th)
Average wind: 5.9 mph
Average relative humidity: 68%
Average sky cover: 50%

Click here for a daily statistical recap for Memphis International Airport.


Cirrus Weather Solutions / MemphisWeather.net, Bartlett, TN

Temperature
Average temperature: 76.3 degrees
Average high temperature: 86.6 degrees
Average low temperature: 66.2 degrees
Warmest temperature: 95.4 degrees (14th)
Coolest temperature: 57.3 degrees (30th)
Comments: Only 10 days had high temperatures at or above 90. The coolest high temperature was a chilly 67.0 on the 18th. The warmest low temperature was 79.4 on the 27th.

Precipitation
Monthly total: 1.99" (automated rain gauge), 1.95" (manual CoCoRaHS rain gauge)
Days with measurable precipitation: 8
Wettest date: 0.71" (1st) (via automated gauge)
Comments: Zero days with more than 1" of rain and one days with more than 0.50".

Miscellaneous
Peak wind: Northwest/30 mph (14th)
Average relative humidity: 79%

Click here for a daily statistical recap for Bartlett, TN.

MWN Forecast Accuracy

MWN average temperature error: 1.92 degrees
MWN forecast temperatures within 2 degrees of actual: 72%
MWN average dewpoint error: 1.88 degrees
MWN forecast dewpoints within 2 degrees of actual: 71%

MWN's forecasts extend out five periods (2.5 days, or roughly 60 hours). Historical accuracy statistics can be found here.

----
Follow MWN on Facebook, Twitter, and Google+
Visit MemphisWeather.net on the web or m.memphisweather.net on your mobile phone.
Download our iPhone or Android apps, featuring StormWatch+ severe weather alerts!

Wednesday, August 6, 2014

Do cool Memphis Julys signal a cold and snowy winter?

A question we have been asked a lot recently is what our unseasonably cool July might mean for the upcoming winter. We decided to look at the top 5 coldest Julys in Memphis and each of the following winters to see if there is any connection between cool summers and the following winter. For the sake of this blog, we will examine the total snowfall from November to March and the month with the coldest average temperature. We will also look at how a developing El Nino could play into our forthcoming winter season of 2014-'15.

To establish a baseline, the average monthly temperature for July is 82.7° and the coldest winter month is January with an average temperature of 41.2°.  Seasonal snowfall averages 3.8". Temperature records date back 140 years and snowfall records are spotty before 1889.


2 of the top 3 snowiest winters occurred following a top 4 cool July!

The Top 6

1. 1891 was the coldest July in Memphis history with an average temperature of 77.0° which was followed by a winter in which the coldest month (January) had an average temperature of 36.0° (about 5 degeres below normal) and a seasonal snowfall total of 24”. That year’s snowfall is made up mostly of the largest snowstorm in Memphis history when 18.5” of snow fell in a single storm on March 16th-17th of 1892. Early in March it appeared that winter had come to an end with temperatures climbing into the 60s and low 70s before a strong mid month cold front dropped temps, which was followed a few days later by the historic snowfall.

2. Next on the list comes 1906 with an average July temp of 77.2° followed by a rather mild winter in which our coldest temps came in February of 1907 as average temps fell to 45.2°. That winter only saw 0.7” of snowfall, well below the current normal seasonal snowfall of about 4”.

3. In 1882, Memphis had an average July temp of 77.6° and the coldest winter month (January) saw an average temp of 39.3°. That winter no snowfall was reported, however due to it being pre-1890, snowfall records are very intermittent and therefore it is possible Memphis saw minor accumulations that were never recorded. The data is simply inconclusive.

4. July 1967 is 4th on our list of coldest in Memphis at 77.7° and was followed by a winter dominated by below normal temperatures with the coldest temps coming in February at 37.2°. Total snowfall for the winter of '67-'68 was 23.8”, or 3rd on the list of snowiest winters. Most of the snow fell in the month of March with the second biggest snowstorm in Memphis history. A total of 17.3” fell over three days. The storm got started with 8.7” falling on March 21st before another 7.4” fell on the 22nd and 1.2” fell on the 23rd, bringing the storm to an end.

5. July 1905 had an average temp of 77.9° to come in as the 5th coldest in Memphis recorded history. Average temps for the winter never fell out of the 40s with the coldest month once again coming in February at 41.7°. Snowfall for the 1905-1906 winter season was below normal with exactly 1” spread across December, January, and February.

6. As you might know from reading our posts, July 2014 was the 6th coolest July on record. So the question remains: can we draw any conclusions from Memphis past to suggest what could occur this winter season? Interestingly the top 2 winter storms in our history have followed one of the coolest Julys on record and 2 of the top 3 snowiest winters also followed top 4 cool Julys and the snowiest winter on record (1917-1918) followed a July that was just outside the top 10% of coolest Julys (#17 out of 140 years). But we have also had two years with well below average snowfall and one unknown due to a lack of reliable records. Much like snowfall totals, winter temperatures also seem to be split, featuring two below average seasons, two above average, and one with temps near normal.

The typical winter weather pattern in an El Nino year features a southerly storm track with cool and wet conditions, especially across the southern U.S. All El Ninos are different however.

Influence of El Nino

So what other factors could have an influence on our overall winter pattern? Though it appears it may not be as strong as previously thought, an El Nino is developing, which typically leads to cooler temps and wetter conditions for the southeast U.S. During an El Nino year, low pressure systems typically track along the southern U.S., often south of the metro near the gulf coast, allowing colder air to move into areas north of the system as moisture is pulled northward, overriding the cold air. As is always the case for us, the exact track of each individual storm decides who is dry and cold, who gets a cool rain, and who sees other types of "fun" precipitation (I expect you may be reading that sentence many times this winter). While there are a few interesting correlations, it appears we cannot draw any real conclusions from our past on what we'll experience this winter. One thing you can be sure of is MWN will be here keeping you updated about it across our social media platforms and of course in detail here on the blog!

Patrick Luckett, MWN Social Media Intern

----
Follow MWN on Facebook, Twitter, and Google+
Visit MemphisWeather.net on the web or m.memphisweather.net on your mobile phone.
Download our iPhone or Android apps, featuring StormWatch+ severe weather alerts!
Icicle photo credit: Suat Eman, FreeDigitalPhotos.net

Tuesday, August 5, 2014

A shift in the weather pattern means higher rain chances for the Mid-South

We were quite spoiled for most of July as Memphis experienced its sixth coolest July on record, but the start of August is bringing more typical summer heat that looks to stick around for a while. As we head into tomorrow, humidity will begin to rise. With temps reaching the mid 90s, heat index values will be near 100 in the afternoon. If working outdoors, practice heat safety by taking frequent breaks and drinking plenty of water. It would also be a good idea to check on the elderly and those with breathing disorders as air quality will suffer as well. Be sure to also keep plenty of water accessible for outdoor pets.

As we near the end of the week, increased cloud cover will keep temperatures closer to 90, however humidity values will go up with dew points reaching 70. It will feel quite muggy! Perhaps the most important point of this blog is the increased rain and thunderstorm chances due to a slight pattern shift in the upper atmosphere. This shift, in which the wind aloft will blow from the northwest (called "northwest flow"), will lessen the cap on the atmosphere, allowing storms to form more easily.

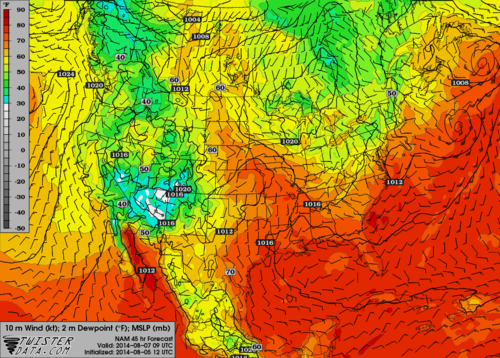
Surface dew points and near surface winds early Thursday morning.
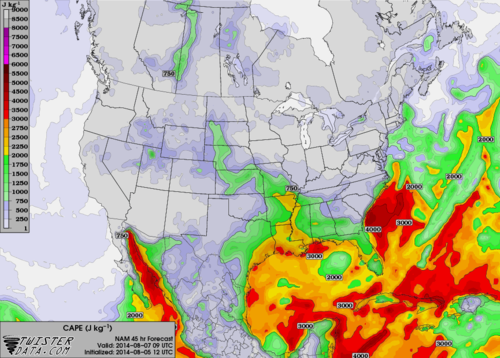
CAPE, a measure of unstable air, early Thursday morning. Values above 2000 will easily support t'storms.
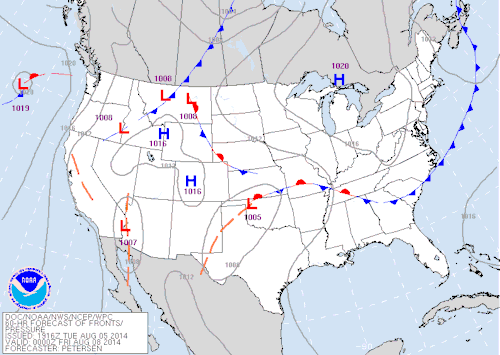
The Weather Prediction Center's forecast of surface fronts late Thursday evening. Note the front across northern portions of the Mid-South.
With a stalled frontal boundary near the region and northwest flow in place, storm systems sparked by upper level disturbances could bring multiple rounds of rain and storms over the region. These systems (called "mesoscale convective systems" or MCS's) are difficult to predict days in advance, but often times in the summer they will set-up along weak boundaries and move great distances. We'll be close enough to a front to possibly be in line for these systems, with air that is plenty unstable to support them.

Due to the uncertain nature of these MCS's, predicting any severe weather associated with them is difficult, but strong wind and possibly small hail is not uncommon as they pass through. For now, no severe weather is predicted for the Mid-South, due mainly to uncertainty in exact timing and track of any storm complexes. However, much of the region could get welcome rain over the next week, as the abundance of June precipitation has evaporated and soil and vegetation are beginning to dry out.

Stay tuned to our social media feeds, website, and mobile apps for the latest on the effects of the upcoming weather pattern shift over the region. Links can be found below.

William Churchill, MWN Social Media Intern
Erik Proseus, MWN Meteorologist

----
Follow MWN on Facebook, Twitter, and Google+
Visit MemphisWeather.net on the web or m.memphisweather.net on your mobile phone.
Download our iPhone or Android apps, featuring StormWatch+ severe weather alerts!